Internal traffic: 72% arrive with it as their first page visited, 21% from assorted sections and 5% from the homepage
A front door
72% reach the weather page as their first page visited. The weather page is a key front door to the site.
Redesign of TN’s weather feature, with the current forecast and an extended weekly version. Built for people arriving from Google and on their phones.
Pick a day and switch between temperature and precipitation. It’s a replica with sample data.
+100%impressions
+40%time on page
+25%engagement
The project set out to completely redesign the weather information in TN’s app and website.
The previous design was dated and showed neither the right information nor what was needed. With research and a benchmark we reached a solution backed by data.
Before designing, we looked in Google Analytics at how people reached the weather page, from inside and outside TN.
Internal traffic: 72% arrive with it as their first page visited, 21% from assorted sections and 5% from the homepage
72% reach the weather page as their first page visited. The weather page is a key front door to the site.
External traffic: 16% arrive from organic Google search and 83% of visits come from mobile
83% of visits come from mobile and 16% arrive from organic Google search. It’s mobile-first, and search engines are a key way in.
We analyzed national and international news outlets. It was key to understanding common behaviors and finding opportunities to add value.
Benchmark matrix: which weather data each analyzed outlet shows and which ones TN’s redesign brings together
We compared temperature, feels-like temperature, chance of precipitation, humidity, iconography, data by province, data by town and extended forecast. TN’s redesign brings it all together on a single page.
To define the information hierarchy we ran a card sorting with one question: what weather information do users prioritize?
First the basics, where and how warm. Then the technical data. That hierarchy organizes the whole page.
We mapped every entry point inside TN: the header widget with the city’s temperature, the mega menu, the homepage and the articles, on desktop and mobile.
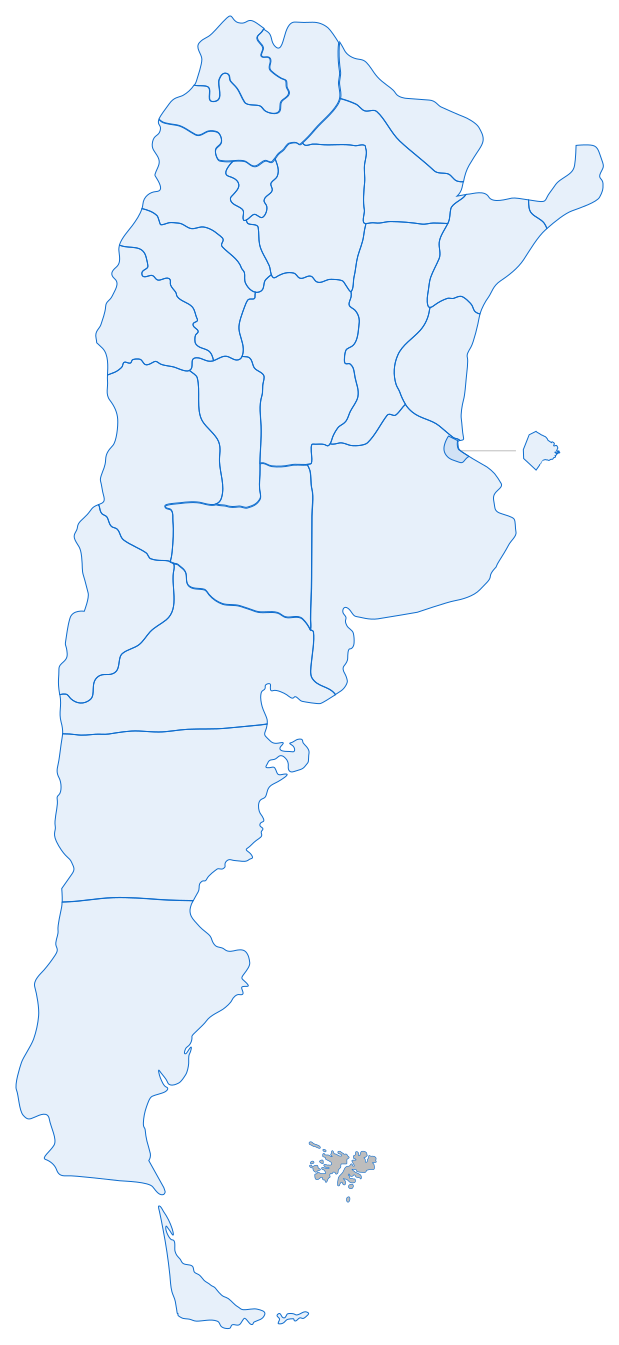
The entry points to the weather inside TN (header, mega menu, homepage and articles) and direct access from Google, all leading to the weather page
Since most people arrive straight from Google, the page had to work on its own, without relying on the site’s navigation.
The card sorting hierarchy, brought to the screen. This is the final version on the phone: each decision highlights its part.
Final mobile screen of TN’s weather: title, search, current weather, extended forecast with day picker and chart, country map and related articles
The components that make up the forecast, as they shipped in the product.
Each day shows its icon, its high and its low. The selected day turns blue and defines the detail shown below. Tap one: the chart changes with it.
A curve with the temperature across the selected day. The same piece switches tabs and turns into bars with the chance of rain.

 120 px, base size80 px, current weather60 px, day picker
Nine weather conditions, each in a day and a night version, and in three sizes. Pick one to see it at each size.
Components rebuilt from the design file, with sample data.
With 83% of visits coming from mobile, the phone screen is the one seen the most. It carries the same hierarchy in a single column.
At the very topThe title, the search and the current weather with its data.
ForecastThe days sit in a row that slides sideways.
ChartsTemperature and rain in tabs, hour by hour.
MapThe country map goes below, with the legend outside the map.
The same page, top to bottom. Designed mobile-first, at 360 px.
We measured real behavior with Clarity.
The weather page with the areas measured with Clarity: the search, the day picker and the chart tabs
With those findings we adjusted the design. The screens in this project already include those adjustments: it’s the final version.


 EN VIVO
 Clima
 Buscar localidad...
 Parcialmente nublado
 Sensación térmica 25ºC
 Lluvias y precipitaciones 24 %
 Humedad 64 %
 Viento a 14 km/h
 Visibilidad 10 km

 Parcialmente nublado